Various Jtag debugger manufacturers are represented in Israel by Pertech Embedded solutions. All are leading embedded system innovators.
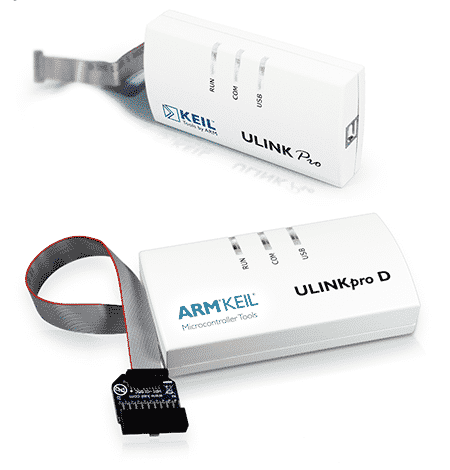
The product line includes Ulink family of products including Ulink2, Ulink PRO, DSTREAMER and others. Jtag link allows the engineer to connect to the target using the JTAG interface, and control the microprocessor. This includes setting hardware breakpoints, step in code and with PRO version trace , you can take a real-time trace. This tool is invaluable to any engineer debugging and testing hardware.
What are embedded systems? These are small, specialized computers, that operate within the bowels of a device that is not necessarily, or primarily, a computer. This means anything you see with a display, keys, or controls a motor is in fact controlled by an embedded computer and is classified as an embedded system. For example telephones, coffee makers, washing machines, trains, planes, cars, solar collection arrays, UAV’s and even lunar vehicles.
Ulink – products and history
What characterizes Arm Ulink products, which have dominated the Embedded System field for the past two decades, is that they are super easy to use, regardless of how complex the industry in which they operate is.
Appropriately, Global Headquarters is in Cambridge, UK, a hub for precision engineering and higher-end products.
The company started out as an independent contractor delivering custom embedded system development to companies. Arm was founded in November 1990 as Advanced RISC Machines Ltd a joint venture between Acorn Computers, Apple and VLSI Technology.
What more should we know about Arm Ulink and Dstream?
Arm DSTREAM-PT is a second-generation debug and trace unit that enables software debug and optimization on Arm processor-based targets. DSTREAM-PT lets you connect the Arm Debugger (provided as part of Arm Development Studio) to your target through JTAG or Serial Wire Debug (SWD) interface. The 8GB buffer within the probe can collect trace data through parallel trace ports of up to 32-bits wide, enabling thorough instruction and data trace from even the most advanced multi-core devices.
All members of the ULINK family of debug and trace adapters enable you to download programs to your target, step through your program, insert breakpoints, and debug your Arm Cortex-M based devices on-the-fly. The sophisticated ULINKpro debug probe provides high-speed data and instruction trace, that lets you analyze your program behavior and generate the necessary code coverage information required for safety certifications. Our newest probe, the ULINKplus, is ideally suited to optimizing battery life in IoT applications. It enables software optimization for ultra-low power applications, test automation, and isolation for high-speed debug and trace of sensitive hardware systems.
The team of professionals at Pertech Embedded solutions will gladly assist you in every question.